
Second quarter Gross Domestic Product (GDP) for the U.S. saw a record contraction of 32.9% as the April through June time period was hit by the COVID induced business shutdowns and stay at home orders. While the large decline is sobering, it is also likely to be short-lived as economic data has been improving. We still have a long way to go to get economic activity back to pre-COVID levels, but the second quarter GDP likely marks the trough in the economy. The current estimate for third quarter GDP growth is +17.8%.
Congress is currently debating a next round of stimulus measures. The enhanced unemployment benefits designed to help families hit by job loss during COVID expired on July 31st. A next round is highly likely but needs to go through the typical debate and grandstanding that we have seen in previous actions by Congress here in 2020.
The weekly initial unemployment claims and continuing claims have started to stall their recent improvement. Initial unemployment claims for the week of July 25th increased to 1.434 million versus 1.422 million the week prior. Continuing claims for the week of July 18th were 17.018 million versus 16.151 million the week prior. Continuing claims peaked at 20.790 million during the week of May 9th. The July Employment Report will be released this coming Friday with a forecast of 2 million net new jobs being added for the month. The May report showed 2.5 million jobs created and the June report showed 4.8 million. Maintaining job creation and business reopening remain key factors to economic recovery.
Similar to economic activity, corporate earnings also likely troughed in the second quarter. Of the 312 companies in the S&P 500 Index that have reported second quarter earnings to date, 82% have reported results above consensus. This is better than the long-term average of 64.9%. The average surprise factor has been 21.7% to the upside. The third consecutive better than expected week has moved current consensus for second quarter S&P 500 earnings to negative 33.8% year-over-year (versus -40.3% last week) on a 10.4% revenue decline (versus -10.6% last week).
In our Dissecting Headlines section, we look at Back-to-School Shopping.
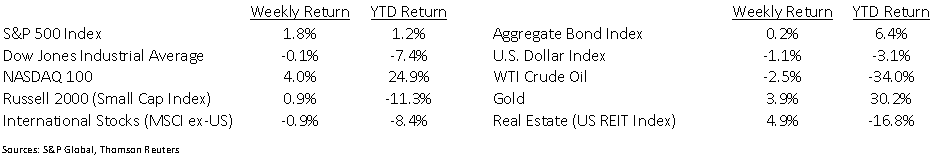
Financial Market Update
Dissecting Headlines: Back-to-School Shopping
Preparing for the school year has traditionally prompted spending on apparel, shoes, school supplies, and technology. This could prove to be a unique back-to-school shopping season given the uncertainty between on-campus, remote and combined learning on tap.
According the National Retail Federation, families with elementary and secondary school children are expected to spend an average $789.49 per family, an increase of 13.3% from 2019. College students are expected to spend an average $1,059.20 per family, an increase of 8.4% from 2019. Total spending for K-12 and college is projected to be $101.6 billion, an increase of 25.9%.
Due to uncertainty surrounding decisions on classroom and remote learning, 72% of survey respondents believe they will need to buy items like computers, home furnishings or other supplies to accommodate learning. Sixty-three percent of K-12 families expect to buy computers and other electronics this year, up from 54% last year. Apparel spending is expected to be flat and school supplies up slightly.
___________________________________________________________
Want a printable version of this report? Click here: NovaPoint August 3, 2020
To learn more about these topics and our investment strategies, call us at 404-445-7885 or contact us here.
Do you understand your personal investment risk tolerance and the risk of your current portfolio? You can learn these by taking our Risk Analysis Questionnaire.