
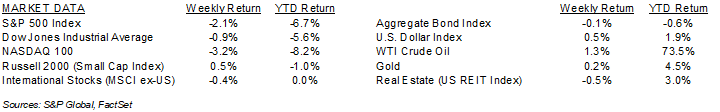
Equities declined for a fifth consecutive week as military action in the Middle East and higher energy prices continue to weigh on investor sentiment. For the week, the S&P 500 Index was -2.1%, the Dow Jones Industrials -0.9%, and the NASDAQ -3.2%. The Energy, Materials, and Utility sectors led the S&P 500 Index for the week, while the Communication Services, Technology, and Financial sectors lagged. The 10-year U.S. Treasury note yield was 4.435% at Friday’s close versus 4.389% the previous week.
We are in the news gap between quarterly earnings reports and there has been a low level of fundamental company news over the past week to help investors make fundamental decisions. This only adds to the focus on geopolitical events. We end the first quarter this week and should start to see greater fundamental news flow when the first quarter earnings season kicks into gear the week of April 13th.
The next update on the labor market is this week with the March Employment Situation report scheduled for release on Friday. CME Fed funds futures are currently forecasting no changes to short-term interest rates for the remainder of the year.
This week four companies in the S&P 500 Index are scheduled to report quarterly earnings. First quarter earnings are expected to grow by 13.0% and quarterly revenue growth is expected at 9.7%. Full-year 2026 earnings are expected to grow by 17.1 % with revenue growth of 8.6%.
In our Dissecting Headlines section, we look at the frequency of market corrections.
Financial Market Update
Dissecting Headlines: Corrections and Recoveries
The NASDAQ composite is down 12.3% from its high seen in October and the Dow Jones Industrial Average is down 10.0% from its high seen in February. The S&P 500 Index has fared the best, down only 8.5% from its high seen in late January.
Whenever stocks decline by 10% it is deemed a market correction. Corrections can usually be tied to events, whether economic or geopolitical, and are not rare. Declines in the S&P 500 Index between 5% and 10%, often referred to as a pull-back, can occur multiple times a year. Corrections between 10% and 20% normally occur every 18-months to two years. Bear markets, the term given to declines over 20% and 40%, happen about every five years, with the last one seen in 2022.
The recoveries from these downturns tend to be proportionate to the magnitude of the declines. The average time to recover from a 5% to 10% decline is one month. For a 10% to 20% decline, the recoveries have averaged four months. For a 20% to 40% decline, the recoveries have averaged 14 months, and for the few severe declines over 40% the recovery time has averaged 58 months.
The current decline can be tied to the war with Iran and its follow-on effects of higher oil prices and inflationary pressures. The timing of a recovery depends on both investors’ view on the military situation and their assessment of the short- or longer-term economic impact.
________________________________________
Want a printable version of this report? Click here: NovaPoint Weekly March 30, 2026
To learn more about these topics and our investment strategies, call us at 404-445-7885 or contact us here.
Do you understand your personal investment risk tolerance and the risk of your current portfolio? You can learn these by taking our Risk Analysis Questionnaire.