
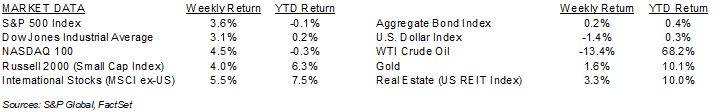
Equities rose sharply last week on the U.S. – Iran ceasefire announcement, but unsuccessful talks in Pakistan over the weekend bring back uncertainty. For the week, the S&P 500 Index was +3.6%, the Dow Jones Industrials +3.1%, and the NASDAQ +4.5%. The Communication Services, Consumer Discretionary, and Technology sectors led the S&P 500 Index for the week, while the Energy, Health Care, and Consumer Staples sectors lagged. The 10-year U.S. Treasury note yield was 4.319% at Friday’s close versus 4.304% the previous week.
The March Consumer Price Index (CPI) showed headline inflation +0.9% month/month and core CPI (ex food and energy) was +0.2% month/month. On a year/year comparison, CPI was +3.3% and core CPI was +2.6%.The main items causing the steep monthly rise were energy commodities with gasoline prices 21.2% higher for the month and fuel oil 30.7% higher.
The Federal Reserve is likely to take no action on interest rates at its April policy meeting as it evaluates the impact of the U.S.—Iran conflict on the economy. Current CME Fed funds futures show no changes to short-term interest rates for the remainder of the year.
The quarterly earnings reporting period begins this week with 28 companies in the S&P 500 Index scheduled to report earnings results. First quarter earnings are expected to grow by 12.6% and quarterly revenue growth is expected at 9.8%. Full-year 2026 earnings are expected to grow by 17.6% with revenue growth of 9.0%.
In our Dissecting Headlines section, we look at the Volatility Index as a mirror of market sentiment.
Financial Market Update
Dissecting Headlines: Volatility Index
When it feels like financial markets can turn on a dime based on global news flow, one way to take the market’s pulse is the Volatility Index, or VIX. The VIX is a measure of investor expectations of market volatility over the next 30-days. The VIX was created by the Chicago Board Options Exchange (CBOE) and is derived from prices of S&P 500 Index options. The VIX is sometimes referred to as the Fear Gauge because when it rises this reflects rising investor fear, or pessimism, on the direction of the market.
Between the February 27th start of hostilities with Iran to the announcement of the ceasefire on April 7th, the VIX rose from 19.86 to 25.78, and it had been as high as 31.05 at its peak during the period. The long term average for the VIX, indicating a “normal” market, is the 19 to 20 range. The VIX ended last week at 19.23, back in the normal range, but elevated tensions over a breakdown in U.S.—Iran talks over the weekend and a coming blockade of the Strait of Hormuz could elevate volatility this week.
To put current events in context, the VIX rose to 89.5 in October 2008 during the Global Financial Crisis, 82.7 during the March 2020 COVID shutdown, 50.0 during the February 2018 volatility spike, 49.0 during the May 2010 Flash Crash, and 49.0 when the markets re-opened after the September 11th Attacks. Volatility can sometimes be caused by financial events and sometimes by geopolitical events.
The VIX does fall once the crisis passes, so the indicator can often be a contrarian signal, meaning that it is advantageous to buy when fear is high to benefit from the post-crisis recovery.
________________________________________
Want a printable version of this report? Click here: NovaPoint Weekly April 13, 2026
To learn more about these topics and our investment strategies, call us at 404-445-7885 or contact us here.
Do you understand your personal investment risk tolerance and the risk of your current portfolio? You can learn these by taking our Risk Analysis Questionnaire.