
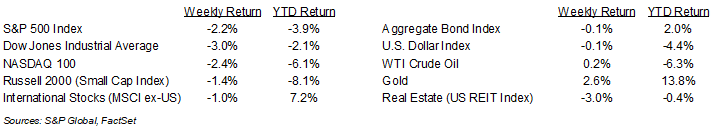
The equity market saw a welcome relief rally on Friday but closed lower for the week. For the week, the S&P 500 Index was -2.2%, the Dow Jones Industrials -3.0%, and the NASDAQ -2.4%. The S&P 500 Index was led by the Energy, Utility, and Financial sectors, while the Consumer Staples, Consumer Discretionary, and Communication Services sectors lagged. The 10-year U.S. Treasury note yield increased to 4.316% at Friday’s close versus 4.315% the previous week.
February inflation indicators improved modestly. The February Consumer Price Index (CPI) was +0.2% month-over-month and +2.8% year-over-year. Core CPI, which excludes food and energy prices, was +0.2% month-over-month and +3.1% year-over-year. All results were 0.1% lower than expectations. The February Producer Price Index (PPI) was flat month-over-month and +3.2% year-over-year. Core PPI, which excludes food, energy, and trade prices, was +0.2% month-over-month and +3.3% year-over-year. This report was also less inflationary than expectations. Congress was able to pass a continuing resolution to keep the government running the remainder of the fiscal year.
A key event this week is the Federal Reserve’s Federal Open Market Committee (FOMC) meeting. While the FOMC is widely expected to keep interest rates steady, its updated Summary of Economic Projections should provide an update to its outlook for the remainder of the year. Fed Chairman Jerome Powell has expressed his confidence that the U.S. economy is in good shape, but that there is uncertainty caused by pending policy changes in trade, immigration, fiscal policy, and regulation. CME Fed funds futures show the Fed on hold for both March and May, and a 0.25% rate cut at the June meeting.
Ten companies in the S&P 500 Index are scheduled to report first quarter earnings this week. First quarter 2025 earnings growth is currently forecast at 7.1% year-over-year with 4.2% revenue growth. Full-year 2025 earnings are expected to grow by 11.5% with revenue growth of 5.4%.
In our Dissecting Headlines section, we look at the frequency of market corrections.
Financial Market Update
Dissecting Headlines: Corrections and Recoveries
Last Thursday, the S&P 500 Index closed down 10.1% from its recent high seen in February. Friday’s relief rally did lift the S&P 500 back to a 8.2% decline from the recent peak. Whenever stocks decline by 10% it is deemed a market correction. While these can be unexpected and result in swift downturns, they are not rare. Declines in the S&P 500 Index between 5% and 10%, often referred to as a pull-back, can occur multiple times a year. Corrections between 10% and 20% normally occur every 18-months to two years. Bear markets, the term given to declines over 20% and 40%, happen about every five years, with the last one seen in 2022.
The recoveries from these downturns tend to be proportionate to the magnitude of the declines. The average time to recover from a 5% to 10% decline is one month. For a 10% to 20% decline, the recoveries have averaged four months. For a 20% to 40% decline, the recoveries have averaged 14 months, and for the few severe declines over 40% the recovery time has averaged 58 months.
Most major declines are associated with severe economic or geopolitical events, whereas the shallower pull-backs or corrections are simply a recurring function of market volatility. Volatility is one of the conditions investors need to accept to benefit from the long-term growth potential of investing in equities.
________________________________________
Want a printable version of this report? Click here: NovaPoint Weekly March 17, 2025
To learn more about these topics and our investment strategies, call us at 404-445-7885 or contact us here.
Do you understand your personal investment risk tolerance and the risk of your current portfolio? You can learn these by taking our Risk Analysis Questionnaire.