
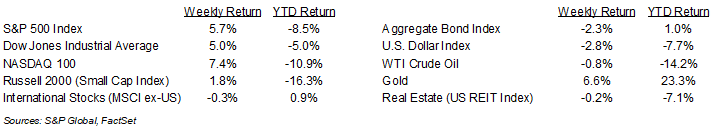
A 90-day pause in the U.S. tariff implementation plan provided equities a large relief rally last week. For the week, the S&P 500 Index was +5.7%, the Dow Jones Industrials +5.0%, and the NASDAQ +7.4%. The S&P 500 Index was led by the Technology, Industrial, and Communication Services sectors, while the Energy, Real Estate and Health Care sectors lagged. The 10-year U.S. Treasury note yield increased to 4.468% at Friday’s close versus 4.013% the previous week.
The U.S. government announced a 90-day pause on recently increased tariffs for most countries to allow time for trade negotiations. China was not included in the pause and the tariff rate on Chinese goods was increased to 125%. Some exemptions are being made for smart phones and other electronics.
March reports on inflation showed a less inflationary scenario, but the data is prior to the enactment of most tariffs, so the extent of tariffs impacting inflation continues to be a heavily debated issue. The March Consumer Price Index (CPI) showed consumer prices -0.1% month-over-month and +2.4% year-over-year. Core CPI, which excludes food and energy prices, was +0.1% month-over-month and +2.8% year-over-year. The March Producer Price Index (PPI) showed wholesale prices -0.4% month-over-month and +2.7% year-over-year. Core PPI, which excludes food, energy, and trade prices, was +0.1% month-over-month and +3.4% year-over-year. Both reports were less inflationary than anticipated. Current CME Fed funds futures indicate there could be up to 0.75% in reductions to the Fed funds rate by December.
First quarter earnings season ramps up this week with 33 companies in the S&P 500 Index scheduled to report earnings results. First quarter 2025 earnings growth is currently forecast at 7.3% year-over-year with 4.3% revenue growth. Full-year 2025 earnings are expected to grow by 10.6% with revenue growth of 5.3%.
In our Dissecting Headlines section, we look at the volatility index.
Financial Market Update
Dissecting Headlines: Volatility Index
The Volatility Index, or VIX, is a measure of investor expectations of market volatility over the next 30-days. The VIX was created by the Chicago Board Options Exchange (CBOE) and is derived from prices of S&P 500 Index options. The VIX is sometimes referred to as the Fear Gauge because when it rises this reflects rising investor fear, or pessimism, on the direction of the market.
The VIX has increased from 17.4 at the end of December to a recent high of 52.3 on April 8th and is now currently at 37.6. The sharp move up was coincident with the retreat in the major stock market indices. While down from the recent level of 52.3, the current 37.6 level is still above the VIX’s historical average of just under 20 and is a reading that reflects considerable near-term uncertainty.
The indicator can often be a contrarian signal, meaning that it is advantageous to buy when fear is high and sell when optimism reigns.
________________________________________
Want a printable version of this report? Click here: NovaPoint Weekly April 14, 2025
To learn more about these topics and our investment strategies, call us at 404-445-7885 or contact us here.
Do you understand your personal investment risk tolerance and the risk of your current portfolio? You can learn these by taking our Risk Analysis Questionnaire.