
The stock market is often seen as a large system that moves in unison based on macroeconomic or geopolitical factors. During corporate earnings season, the bottom-up impact of each company reporting earnings can be seen individually, often with significant disparity, making it more of a market of stocks. The volume of second quarter earnings reports increases this week with 145 companies scheduled to report earnings.
Seventy-nine companies in the S&P 500 have reported quarter-to-date with 77% reporting earnings above expectations, 20% below expectations, and 3% in-line. Due to relative upbeat earnings reports last week, the current consensus expectations for the S&P 500 Index has flipped from a –0.4% expectation last week to a current expectation of +1.0% earnings growth year-over-year. The expectation for revenue growth has increased from +3.3% to +3.4%.
The 10 largest companies in the S&P 500 Index comprise almost 23% of the Index, so their earnings impact can be significant. Three companies (Microsoft, JP Morgan, and Johnson & Johnson) have already reported. Four more of the top 10 report this week (Amazon, Facebook, Alphabet and Visa).
On the horizon, July will close with a two-day meeting of the Federal Open Market Committee to discuss its assessment of current economic conditions and vote on whether to reduce its short term interest rate target. The current market probabilities are for a reduction of 0.25% which would bring the target range for the Fed Funds Rate to 2.00% to 2.25%.
Disclosure: We own Microsoft and Johnson & Johnson in the NovaPoint Dividend Growth Strategy.
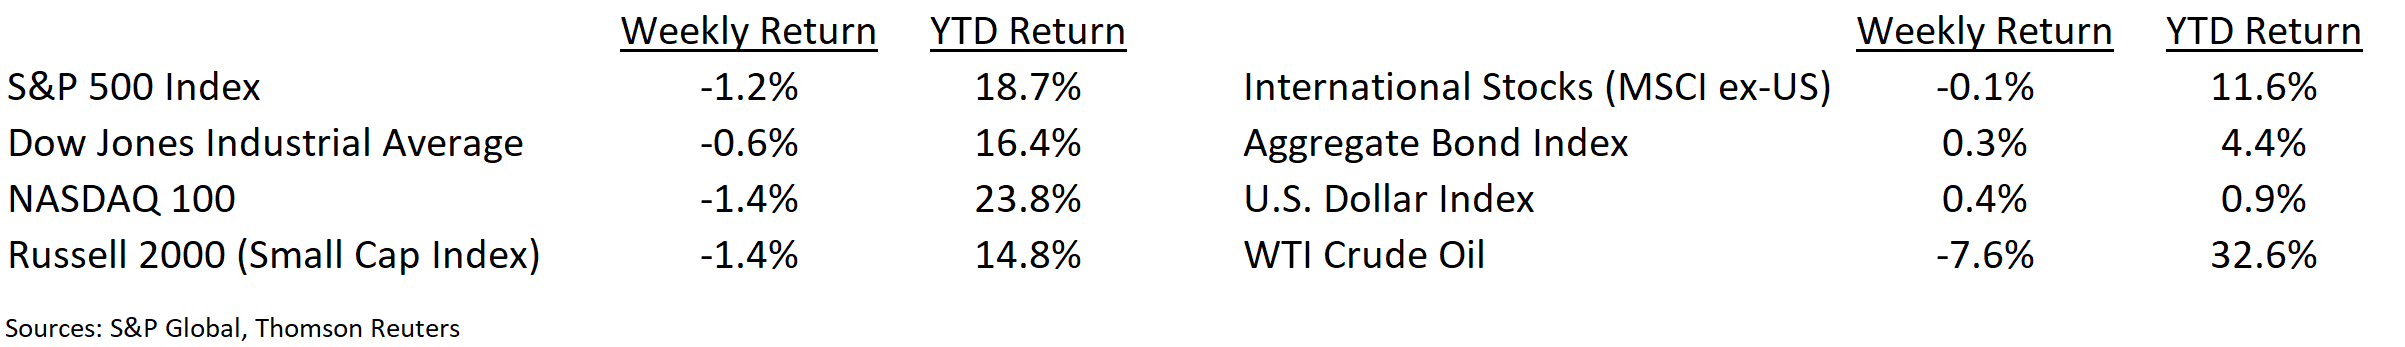
Financial Market Update
Dissecting Headlines: The Volatility Index (VIX)
Investor sentiment of the stock market can swing back-and-forth between fear and greed. One way to measure this level of fear versus greed is through the Volatility Index, or VIX. This is a measure of investor expectations of market volatility over the next 30-days. The VIX was created by the Chicago Board Options Exchange (CBOE) and is derived from prices of S&P 500 Index options.
The VIX is sometimes referred to as the Fear Gauge because when it rises it reflects rising fear, or pessimism, on the direction of the market. During the May 2019 6.4% market decline, the VIX began the month at 14.80, peaked at 20.55 on May 13th and ended the month at 18.71. During June’s 7.0% market increase, the VIX peaked at 18.86 on June 3rd and then declined to 15.08 by month end. The indicator can often be a contrarian signal, meaning that it is advantageous to buy when fear is high and sell when optimism reigns.
Over the past 10-years, the VIX has averaged 17.26, with a low of 9.14 and a high of 48.00. The VIX is currently at 14.45. Take a look at week’s end and see if market sentiment has become more optimistic (VIX declines) or more pessimistic (VIX advances).
___________________________________________________________
Want a printable version of this report? Click here: NovaPoint July 22, 2019
To learn more about these topics and our investment strategies, call us at 404-445-7885 or contact us here.
Do you understand your personal investment risk tolerance and the risk of your current portfolio? You can learn these by taking our Risk Analysis Questionnaire.