
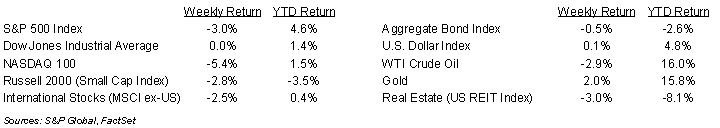
Stocks continued their decline for the third consecutive week. For the week, the S&P 500 Index was -3.0%, the Dow was flat, and the NASDAQ was -5.4%. Within the S&P 500 Index, the Utility, Consumer Staples, and Financial sectors had gains for the week, while the Technology, Consumer Discretionary, and Real Estate sectors had the largest declines. The 10-year U.S. Treasury note yield increased to 4.614% at Friday’s close versus 4.521% the previous week.
The downward pressure on the market has been caused by a concern the potential for an easing of monetary policy by the Federal Reserve keeps slipping further away. On Tuesday, Fed Chairman Jerome Powell indicated it was taking longer for Fed officials to gain confidence that enough progress was being made on reducing inflation and that the Fed would leave interest rates at current levels until they did. The probability for an initial rate cut is in September. A key economic event this week is the release of the March Personal Consumption Expenditures (PCE) Price Index scheduled for Friday.
We are entering the prime part of the first quarter earnings reporting period with 158 companies in the S&P 500 Index scheduled to report earnings this week. The current first quarter consensus forecast for the S&P 500 Index is 0.5% earnings growth with revenue growth of 3.5%. Full-year 2024 earnings for the S&P 500 Index are expected to grow by 10.7% with revenue growth of 5.0%.
In our Dissecting Headlines section, we look at technical analysis levels for the major market indices.
Financial Market Update
Dissecting Headlines: Technical Analysis Levels
Over the past three weeks, the S&P 500 Index has declined 5.4%. The index level from three weeks ago was also the closing high for the current cycle. Last week’s decline took the index below its 50-day moving average. A moving average is an indicator that calculates the average price of an index or other security over a specified period of time. They also serve as dynamic support and resistance levels. In the case of the S&P 500 Index, its current price level of 4,967.23 fell below the 50-day moving average of 5,118.31. It is still above the 200-day moving average of 4,674.08. The 50 and 200-day moving averages are popular indicators of the intermediate and longer-term trends in the market. A decline to the 200-day moving average would be an additional 5.9% decline.
The Dow Jones Industrial Average is down 4.5% over the past three weeks. Its current price level of 37,986.40 is also below its 50-day moving average of 38,817.25. It is still above its 200-day moving average of 36,214.55. The NASDAQ 100 Index is down 6.6% over the past three weeks. Its current price level of 17,037.65 is below its 50-day moving average of 17,972.47 and above its 200-day moving average of 16,266.58.
For all three major indices we can see that the short to intermediate trend is negative as prices appear to be correcting after a healthy upward move in the first quarter of the year. All three indices remain positive for the year with the S&P 500 +4.6%, the Dow +1.4%, and the NASDAQ 100 +1.5%. Pullbacks can be healthy as they both remove some short-term speculation and create entry-points for longer term investors.
If the three market indices seem to have similar patterns, it is because they have many overlaps of the same stocks in each index. It is also because they are being impacted by the same economic and geopolitical events.
________________________________________
Want a printable version of this report? Click here: NovaPoint Weekly April 22, 2024
To learn more about these topics and our investment strategies, call us at 404-445-7885 or contact us here.
Do you understand your personal investment risk tolerance and the risk of your current portfolio? You can learn these by taking our Risk Analysis Questionnaire.