
The NASDAQ increased 2.0% for the week to snap its three-week losing streak while the S&P 500 fell 0.6%. The S&P 500 Index has declined 5.8% since the beginning of September and the relatively higher technology weighted NASDAQ 100 Index has declined 7.9% over the same time frame.
This Friday we get data from the Labor Department on September employment. This will be the last Employment Report before the election. The unemployment rate should continue to trend down from August’s 8.4% rate.
Weekly Initial Claims for Unemployment averaged 210,000 per week leading up to the COVID pandemic. After a peak of 6.9 million the week ending March 28th, they have fallen to a current 870,000 last week. Continuing Claims for Unemployment is the recovery gauge to us. Continuing Claims averaged 1.7 million leading up to the COVID pandemic, peaked at 24.9 million the week ending May 9th, and are currently at 12.6 million. As we saw in the State-level unemployment data from last week, most unemployed workers are in States with still high levels of lockdowns or other restricted activity (CA, NY, NJ, IL, etc.) or are tourist destinations such as Hawaii and Nevada.
Much of the headline focus should start to tilt toward the election which is just over a month away. The first Presidential debate is scheduled for Tuesday night. This will be followed by the Vice-Presidential debate on October 7th and two more Presidential debates on October 15th and 22nd.
With September ending this week, we will soon be in the third quarter reporting period. Current expectations are for third quarter earnings for the S&P 500 to be down 21.7% year-over-year versus the 30.6% decline for the second quarter. The current estimate for calendar year 2020 earnings is –19.8% and the estimate for calendar year 2021 earnings is +28.0%.
In our Dissecting Headlines section, we monitor the Volatility Index (VIX) as we lead up to the election.
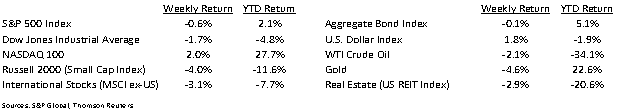
Financial Market Update
Dissecting Headlines: Minding the VIX
The stock market likes certainty. In times of uncertainty, stock movement gets volatile. As we lead up to the election, we can measure that level of certainty or uncertainty by using the Volatility Index, or VIX. When the results of the Presidential election were unknown late in the evening of November 8, 2016, the S&P 500 Index futures began falling. Once the results were known, the S&P 500 Index finished +1.5% the day following the election.
The VIX is a measure of investor expectations of market volatility over the next 30-days. The VIX was created by the Chicago Board Options Exchange (CBOE) and is derived from prices of S&P 500 Index options. When the VIX rises it reflects rising fear, or pessimism, on the direction of the market.
The VIX hit a high of 82.7 as fear and uncertainty over the Coronavirus was peaking in March. It has since returned to a more normal level of 26.4. Watching the VIX over the next few weeks may give some indication of investor certainty or uncertainty leading up to Election Day.
___________________________________________________________
Want a printable version of this report? Click here: NovaPoint September 28, 2020
To learn more about these topics and our investment strategies, call us at 404-445-7885 or contact us here.
Do you understand your personal investment risk tolerance and the risk of your current portfolio? You can learn these by taking our Risk Analysis Questionnaire.