
As we mark the halfway point in 2020, we have seen some rapid fluctuations between optimism and pessimism over the course of six months. We entered the year with a strong economy, a robust stock market, and a Federal Reserve that was committed to economic expansion. We have since witnessed the social and economic impact of the COVID-19 outbreak and a stock market that declined severely and then bounced back strongly. We addressed some of the factors for the stock market rebound in a report earlier this month: “Down and Back” NovaPoint Commentary from June 11th
Markets declined last week as an uptick in COVID cases has multiple states either resuming some level of closings or pausing some opening plans. The uptick in cases has not resulted in an increase in mortality rates as the majority of new cases are in younger, healthier adults and many are asymptomatic. Still, any restriction of economic activity is a drag on the pace of recovery.
As we prepare to sift through second quarter earnings reports, it is important to put the severe year-over-year declines in context and factor in current trends. S&P 500 earnings for the second quarter are forecasted to decline 43.2% on a 11.9% revenue decline. This is coincident with U.S. second quarter GDP currently forecast to be down 34.8%. The second quarter should mark a trough in both corporate earnings and GDP decline. Barring another COVID-like event, we should see incremental growth in the second half of 2020 and above-average growth in 2021.
Initial unemployment claims for the week of June 20th decreased to 1.480 million versus 1.540 million the week prior. The four-week moving average decreased to 1.621 million. Continuing Claims for June 13th were 19.522 versus 20.289 the week prior. The weekly new claims are being counterbalanced by new jobs created and furloughed workers returning to jobs. We view gains in employment to be a significant indicator of the health of the economy and a measure of a return to normal economic and social activity.
In our Dissecting Headlines section we look at the Institute for Supply Management Manufacturing and Non-manufacturing reports.
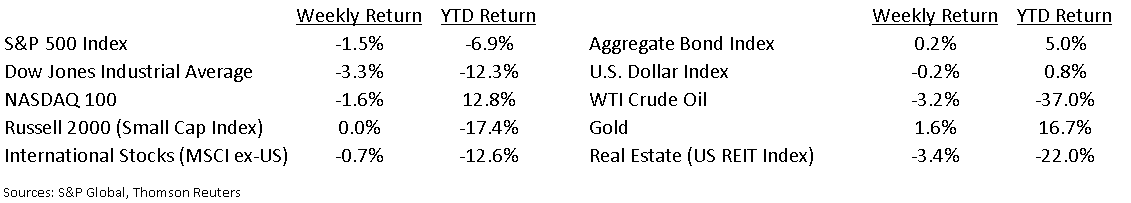
Financial Market Update
Dissecting Headlines: ISM Reports
The Institute for Supply Management (ISM) is a business organization of purchasing and supply chain professionals around the world. The ISM produces two highly watched monthly economic reports it creates from survey data of its members: The ISM Manufacturing Report which covers the manufacturing sector and the ISM Non-Manufacturing Report which covers the service sector. These are two additional monthly data points to measure the pace of economic recovery.
The Manufacturing Report monitors changes in production levels, employment, new orders, deliveries, and inventories from month to month. A diffusion index is created from the data and an index reading above 50 indicates expansion of activity versus the previous month and a reading below 50 indicates contraction of activity. The Non-Manufacturing Report is similar and measures employment trends, prices, and new orders in the service sector.
The May ISM Manufacturing Report was at 43.1 and the Non-manufacturing was at 45.4, both indicating contraction. The June Manufacturing report is scheduled for release on July 1st and Non-manufacturing on July 6th.
___________________________________________________________
Want a printable version of this report? Click here: NovaPoint June 29, 2020
To learn more about these topics and our investment strategies, call us at 404-445-7885 or contact us here.
Do you understand your personal investment risk tolerance and the risk of your current portfolio? You can learn these by taking our Risk Analysis Questionnaire.