
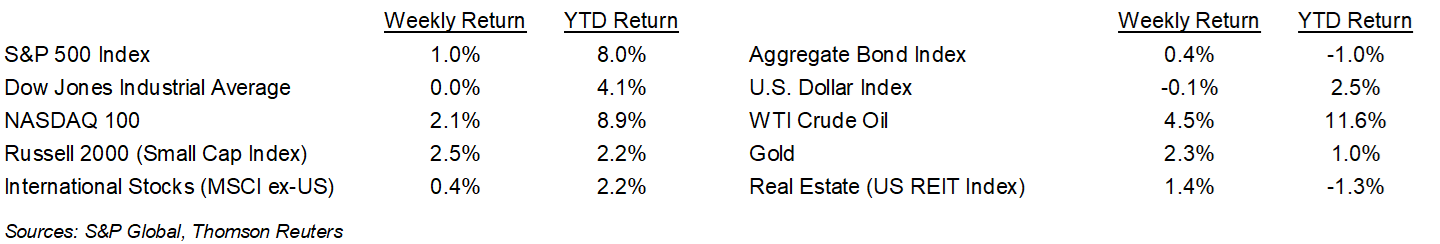
Stocks have come into March like a lion year-to-date with the S&P 500 Index +8.0%. For the week, the S&P 500 Index was +1.0%, the Dow was flat, and the NASDAQ was +2.1%. The S&P 500 Index was led by the Technology, Real Estate, and Consumer Discretionary sectors, while the Health Care, Consumer Staples, and Utility sectors lagged. The 10-year U.S. Treasury note yield decreased to 4.182% at Friday’s close versus 4.260% the previous week.
Optimism was provided by the January Personal Consumption Expenditures (PCE) Price Index which showed inflation levels similar to the Consumer Price Index (CPI) which was released earlier in the month. Year-over-year inflation in the PCE was +2.4% and core inflation, which excludes food and energy prices, was +2.8%. The core PCE Price Index is the data that the Federal Reserve uses to measure inflation and its 2% annualized target. The current data likely keeps the Fed on hold for the March Federal Open Market Committee (FOMC) meeting and CME Fed funds futures current imply a 97.0% probability that rates remain in the 5.25% to 5.50% target range for March. CME futures also show a 73.6% probability that the Fed funds rate does not move at the May meeting. The probability for a first rate cut in June is 54.3%.
The fourth quarter earnings reporting period is almost complete with 487 companies in the S&P 500 Index already reported. An additional five companies are scheduled to report earnings this week. Current fourth quarter expectations for the S&P 500 Index are earnings growth of 9.8% and revenue growth of 3.7%. For full-year 2023, S&P 500 Index earnings are expected to grow by 4.0% with revenue growth of 2.4%. For full-year 2024, earnings are expected to grow by 9.7% with revenue growth of 4.6%.
In our Dissecting Headlines section, we look at the money spent during an election cycle.
Financial Market Update
Dissecting Headlines: Election Spending
We are all used to politicians spending our money. During an election year, they also spend their donors’ money. Whether small individual donors or PACs and Billionaires, money flows into campaigns and is spent to raise candidate profiles, amplify messages, and influence voters who to pull the lever for.
The 2020 election cycle in the United States was the most expensive on record with spending of $14.4 billion, based on data from the Federal Election Commission. This crushed the 2016 spending total of $6.5 billion. Of the $14.4 billion total, $5.7 billion was spent on the presidential candidates and $8.7 billion was spent on the senate and congressional candidates. By political party, $8.4 billion was spent by the Democrats in 2020, $5.3 billion was spent by Republicans, and the remainder by other third parties. Part of the large spend in 2020 was due to the Georgia senate election and subsequent special election which cost a total of $873 million.
Most of the money goes toward advertising spending, which totaled $9.0 billion in 2020, including $3.3 billion spent on down ballot state and local races and other initiatives. Ad spend for the 2024 race is expected to increase to $10.2 billion, and could be as high as $15 billion higher if there are run-offs or races look tight in key battleground states.
Who benefits other than the politicians? Advertising and media companies, especially local broadcast television, billboard, print, and direct mail. An increasing allocation also goes toward digital advertising.
________________________________________
Want a printable version of this report? Click here: NovaPoint Weekly March 4, 2024
To learn more about these topics and our investment strategies, call us at 404-445-7885 or contact us here.
Do you understand your personal investment risk tolerance and the risk of your current portfolio? You can learn these by taking our Risk Analysis Questionnaire.