
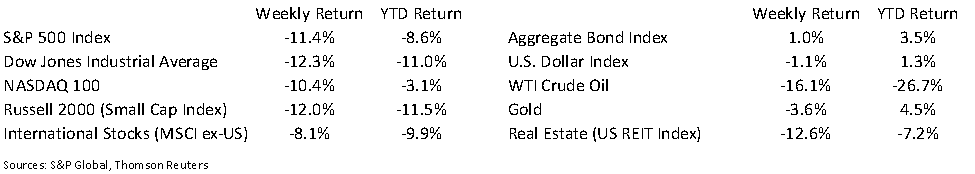
Global equity markets had their worst week in several years last week. The weekly decline, due to economic concerns surrounding the spread of the coronavirus (COVID-19), has pulled all major stock indices into negative territory for the year. Market volatility, which included several large intra-day swings, is indicative of the uncertainty. In our Dissecting Headlines section, we revisit monitoring the Volatility Index as a way to monitor equity market pessimism / optimism.
We believe that the economy and market should self-correct over time. Interest rates have declined as a “flight to safety” in U.S. Treasury Bonds has dropped the yield on the 10-year Treasury to around 1.15%. This reduces borrowing costs for many companies and consumers. For example, mortgage rates declined last week, making home purchase or refinance a more attractive option. Oil prices also fell which should reduce gasoline prices at the pump for consumers and reduce input costs for the transportation and manufacturing sectors. These positive drivers can start to offset negative headwinds such as supply chain delays, lower corporate and consumer confidence, and lower demand for travel and other activity-based actions. Additionally, the Federal Reserve has commented that it is committed to economic expansion in the U.S. as long as inflation remains contained, and is prepared to use its tools and act as appropriate to support the economy. This had led speculation that the Fed could lower short-term interest rates if the coronavirus weakens economic activity.
As with past health-related threats (SARS, MERS, H1N1), the financial markets generally regain confidence once the spread of the virus slows and activity levels return to normal.
Financial Market Update
Dissecting Headlines: Revisiting the VIX
We explained the Volatility Index (VIX) back in a July 2019 Dissecting Headlines report. The VIX is a measure of investor expectations of market volatility over the next 30-days. The VIX was created by the Chicago Board Options Exchange (CBOE) and is derived from prices of S&P 500 Index options.
When the VIX rises it reflects rising fear, or pessimism, on the direction of the market. The indicator can often be a contrarian signal, meaning that it is advantageous to buy when fear is high and sell when optimism reigns.
Over the past 10-years, the VIX has averaged 17.26, with a low of 9.14 and a high of 48.00. The VIX moved from 14 to 40 last week on economic fears. Take a look at week’s end and see if market sentiment has become more optimistic (VIX declines) or more pessimistic (VIX advances) based on its assessment of the global economy. As we saw last week, things can change quickly.
___________________________________________________________
Want a printable version of this report? Click here: NovaPoint March 2, 2020
To learn more about these topics and our investment strategies, call us at 404-445-7885 or contact us here.
Do you understand your personal investment risk tolerance and the risk of your current portfolio? You can learn these by taking our Risk Analysis Questionnaire.