
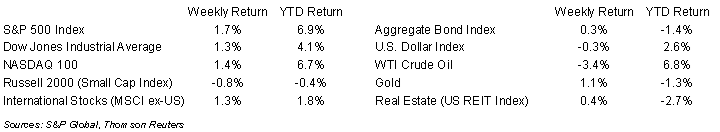
The S&P 500 Index leaped back to new highs last week. For the week, the S&P 500 Index was +1.7%, the Dow was +1.3%, and the NASDAQ was +1.4%. The S&P 500 Index was led by the Consumer Staples, Materials, and Industrial sectors, while the Energy, Real Estate, and Communication sectors lagged. All eleven sectors had positive returns last week. The 10-year U.S. Treasury note yield decreased to 4.260% at Friday’s close versus 4.295% the previous week.
The January Personal Consumption Expenditures (PCE) Price Index is scheduled for Thursday. The core PCE Price Index is the data that the Federal Reserve uses to measure inflation and its 2% annualized target. With the recent Consumer Price Index (CPI) and Producer Price Index (PPI) reports showing inflation remained sticky in January, the PCE report could have a large influence on monetary policy at the March Federal Open Market Committee meeting (March 19-20th). Current CME Fed funds futures imply a 97.5% probability that rates remain in the 5.25% to 5.50% target range for March and 78.8% for May. The probability for a first rate cut in June is 52.6%.
The fourth quarter earnings reporting period is almost complete with 448 companies in the S&P 500 Index already reported. An additional 29 companies are scheduled to report earnings this week. Current fourth quarter expectations for the S&P 500 Index are earnings growth of 10.0% and revenue growth of 3.4%. For full-year 2023, S&P 500 Index earnings are expected to grow by 4.2% with revenue growth of 2.1%. For full-year 2024, earnings are expected to grow by 9.5% with revenue growth of 4.8%.
In our Dissecting Headlines section, we look at differences between the PCE and CPI as measures of inflation.
Financial Market Update
Dissecting Headlines: PCE versus CPI
With the pace of inflation being a key input to monetary policy decisions by the Federal Reserve, it helps to understand the data cited each month as measurements of inflation. The two main data points are the Consumer Price Index (CPI) and the Personal Consumption Expenditures (PCE) Price Index.
The CPI appears to be the more popular of the two price measurements in the financial media. It gets released earlier in the month and it is used to adjust social security payments, while also being the reference rate for some financial contracts such as Treasury Inflation Protected Securities (TIPS). The Federal Reserve prefers to look at the PCE when it is considering the level of price inflation in the economy. In particular, the core PCE, which excludes the impact of food and energy prices, is the data point cited in the quarterly Summary of Economic Projections when referencing its 2% inflation target.
Both Indices measure the change in price of a basket of goods and services, but the weightings in each basket can differ. The CPI is based on a survey of what households are buying, while the PCE is based on surveys of what businesses are selling. Another difference is that CPI measures what consumers pay out of pocket and doesn’t include some expenditures such as medical care paid for by employer-provided insurance, Medicare, and Medicaid, all of which are included in the PCE. The last major difference, which we think is the easiest to understand, is the substitution effect. If the price of beef increases more than the price of chicken, consumers may buy less beef and more chicken. This realignment of the basket is accounted for in the PCE, but not the CPI.
At the March FOMC meeting, the committee will release an updated Summary of Economic Projections. Any change in its outlook for core PCE, currently at 2.4% for 2024, 2.2% for 2025, and 2.0% for 2026, can give us clues to the direction of monetary policy and potential interest rate changes.
________________________________________
Want a printable version of this report? Click here: NovaPoint Weekly February 26, 2024
To learn more about these topics and our investment strategies, call us at 404-445-7885 or contact us here.
Do you understand your personal investment risk tolerance and the risk of your current portfolio? You can learn these by taking our Risk Analysis Questionnaire.