
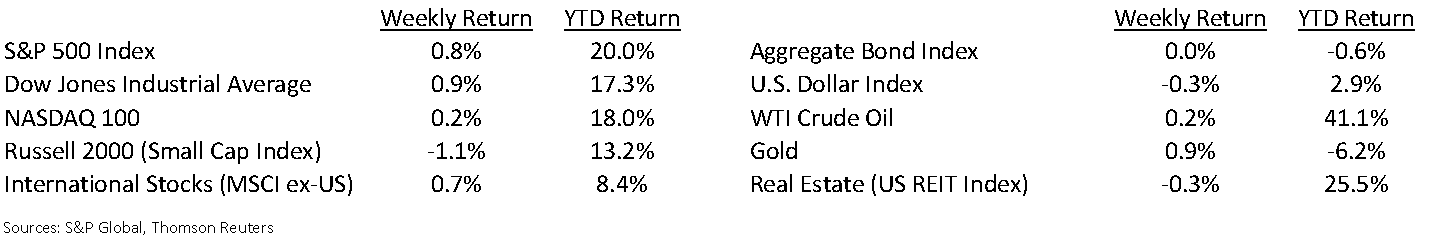
While inflation sparked by the rapid economic rebound is still elevated, the recent Consumer Price Index (CPI) and Producer Price Index (PPI) reports may suggest the surge is losing some steam. We are not out of the woods yet, but the concern of runaway inflation may be overdone. The S&P 500 Index closed the week +0.8%, the NASDAQ +0.2% and the Dow +0.9%. The U.S. 10-year Treasury bond yield decreased to 1.283% at Friday’s close versus 1.305% the previous week.
The second quarter earnings reporting season turns to some of the major retailers this week. In all, 19 companies in the S&P 500 are scheduled to report earnings. The current expectation for 2Q is for S&P 500 earnings growth of 93.8% y/y versus a 93.1% forecast last week. The July Retail Sales report is also scheduled for this week, so we should get a clearer picture on recent retail spending trends.
Initial unemployment claims for the week of August 7th decreased to 375,000 versus the previous week at 387,000. Continuing claims for July 31st were 2.866 million versus 2.980 million the week prior. The minutes of the Federal Reserve’s recent Federal Open Market Committee are scheduled to be released this week. That could shed some additional light on the Fed’s views on when it could act on tapering bond purchases.
In our Dissecting Headlines section, we look at the July CPI and PPI reports to gauge the current levels of inflation in the economy.
Financial Market Update
Dissecting Headlines: July Inflation Trends
While inflation levels are still elevated and above the Fed’s target levels, the July CPI report showed the month-to-month change in prices had abated with headline inflation increasing 0.5% month-to-month versus 0.9% month-to-month in June. The year-over-year inflation rate was +5.4%, which was consistent with last month.
The CPI excluding food and energy prices was +0.3% month-to-month in July versus +0.9% month-to-month in June. Energy prices had the highest month-to-month increase in July out of the major categories at +2.3%. Food gained 0.7% month-to-month in July versus +0.8% month-to-month in June. Used car prices, which had been increasing rapidly, slowed. Used car prices were 0.2% higher month-to-month versus a string of +10.0% (April), +7.3% (May), and +10.5% (June) monthly increases. New car prices were +1.2% month-to-month in July versus +2.0% in June.
The PPI report showed final demand prices +1.0% month-to-month in July, consistent with a 1.0% increase in June. The year-over-year change was +7.8% in July versus +7.3% in June. Final demand prices for goods decelerated month-to-month with a 0.6% increase in July versus +1.2% in June while final demand prices for services accelerated month-to-month with a 1.1% increase in July versus +0.8% in June.
________________________________________
Want a printable version of this report? Click here: NovaPoint August 16, 2021
To learn more about these topics and our investment strategies, call us at 404-445-7885 or contact us here.
Do you understand your personal investment risk tolerance and the risk of your current portfolio? You can learn these by taking our Risk Analysis Questionnaire.