
The stock market bottomed 10-years ago on March 9, 2009, signaling the beginning of a recovery from the financial crisis. Since that time, the S&P 500 Index has achieved a 400% total return, the Dow Jones Industrial Average has achieved a 402% total return, and the NASDAQ 100 has achieved a 650% total return. If an individual had waited 6-months after the market bottomed (due to fear or other reasons), their return would have been 181% for the S&P 500, 198% for the Dow, and 357% for the NASDAQ. A great amount of the excess return could be achieved by prescient market timing, but this is hindsight.
If an individual was fully invested as of October 9, 2007 (the peak of the market prior to the crisis) their total return would have been 124% for the S&P 500, 142% for the Dow, and 264% for the NASDAQ. Even if the individual had been fully invested and completely ignored the financial crisis, they would have more than doubled their money over ten years, which is a reasonable expectation that would suit most retirement planning scenarios.
Additionally, almost one-third of the total return in the S&P 500 came from the impact of dividends (305% 10-year price return versus 400% 10-year total return).
In our view, time proves to be the most consistent winner. Additionally, adding to investments over time and rebalancing when appropriate can help individuals achieve their investment goals.
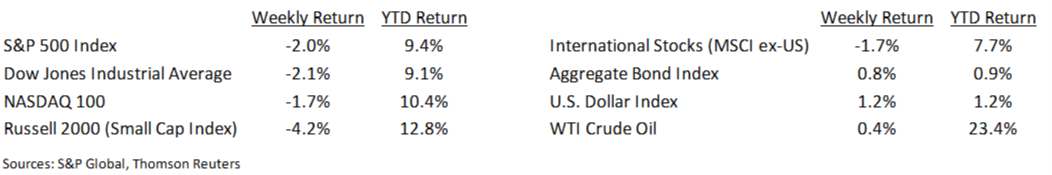
Financial Market Update
Dissecting Headlines: Growth Stocks and Value Stocks
Most investors are used to stocks being classified by size such as Large Cap or Small Cap. They are also classified by style with one of the most popular classifications being Growth and Value. Within a Large Cap Index, such as the Russell 1000, there can also be a differentiation by style producing the Russell 1000 Growth and the Russell 1000 Value. There are not 1000 stocks within each, these are subsets of the Russell 1000. The Russell 1000 Growth currently holds 545 stocks and the Russell 1000 Value holds 724 stocks (there is an overlap of companies).
Growth stocks are weighted in their Index based on their earnings growth rate two-year forecast and sales/share five-year historical sales. The focus is on their ability to grow earnings. Value stocks are weighted in their Index based on Book-to-Price Ratio. Their focus is on valuation relative to their balance sheet equity. The growth stock index is more weighted in Technology, Consumer Discretionary, Health Care, Industrial and Financial Services stocks. The Value stock index is more weighted in Financial Services, Health Care, Utilities, Consumer Discretionary, and Energy stocks. Again, there is an overlap, but sectors help us see the tilt of each style index.
Want a printable version of this report? Click here: NovaPoint March 11, 2019
To learn more about these topics and our investment strategies, contact us today at 404-445-7885 or contact us here.
Do you understand your personal investment risk tolerance and the risk of your current portfolio? You can learn these by taking our Risk Analysis Questionnaire.