
Global equity markets had a strong recovery rally last week as scenarios begin to firm up of when the COVID-19 peaks in various countries and the global economy begins to re-open. While the social and economic recovery is likely to last several months or longer, the financial markets tend to anticipate outcomes and a view that the worst could possibly be over is serving as a catalyst for investors.
In an attempt to bring some stability to the oil market, the OPEC+ members, mainly Saudi Arabia and Russia, will reduce oil production by 9.7 million barrels per day and a group of other countries to include Brazil, Canada and the U.S. will reduce production by 3.7 million barrels per day. The world is still likely to have excess production versus current market demand until there is an increase in demand for transportation fuels (airlines, cars, etc.) when economies start to re-open.
We continue to monitor employment as a key metric to gauge the potential economic impact from COVID-19. First-time unemployment claims for the week of April 4th were 6.6 million, a modest decrease from 6.9 million the week prior. The four-week moving average increased to 4.3 million from 2.7 million as the larger increases from the past two weeks average into the moving average calculation. The levels in these numbers over the next few weeks are going to be important to see if we’ve hit the peak and how it ramps down.
This week provides us with a look under the hood as the first quarter earnings season kicks off with several Financial, Healthcare and other companies reporting. The usual quarterly consensus for earnings is likely useless for comparison or evaluation. The value in the earnings reports and, more importantly conference calls, is to hear as much real-time data and observations of what companies are doing to manage through the current economic environment and what they are planning for the coming months.
In our Dissecting Headlines section, we look at recovery shapes to see what V-shaped, U-shaped and L-shaped mean to market watchers and economists.
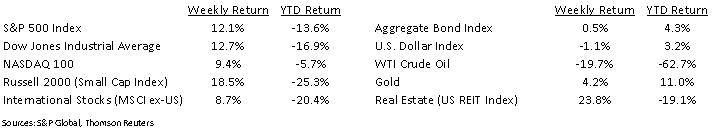
Financial Market Update
Dissecting Headlines: Recovery Shapes
When looking at chart of any type of data, shapes and patterns can emerge. When there is a downturn in data, especially a steep downturn, it can form the left side of a V, U or L. Market watchers and economists often speculate on how the change in the data may turn out on the other side. If there is a steep decline and steep recovery, that is referred to a V-shaped recovery. A more moderate bottoming formation in the data, indicating that activity has stopped incrementally declining but hasn’t started to recover is referred to as a U-shaped recovery. A steep decline with no visible recovery, or a prolonged recovery, is referred to as a L-shaped recovery.
The current debate in the economy and financial markets is what shape of recovery may emerge, which is another way of referencing whether we will experience a rapid, moderate, or prolonged recovery. We don’t have GDP data to determine the recovery in the economy yet. The stock market has exhibited the start of a V-shape, but it is too early to know. Time will tell.
___________________________________________________________
Want a printable version of this report? Click here: NovaPoint April 13, 2020
To learn more about these topics and our investment strategies, call us at 404-445-7885 or contact us here.
Do you understand your personal investment risk tolerance and the risk of your current portfolio? You can learn these by taking our Risk Analysis Questionnaire.