
Investors appear to be absorbing the inflation story well as the equity markets all posted positive returns for the week. The Dow Jones Industrial Average closed the week +1.0%, the S&P 500 Index was +1.2%, and the NASDAQ 100 Index was +2.0%. The U.S. 10-year Treasury bond yield decreased to 1.593% at Friday’s close versus 1.632% the previous week, potentially indicating bond market investors are buying into the transitory inflation thesis.
Much of America appears to be moving past COVID during the holiday weekend. You may have seen traffic, crowded restaurants, and greater activity at malls, movie theaters, and recreational outlets. Airports saw the highest number of travelers since the onset of the pandemic.
With only 11 companies in the S&P 500 Index left to report earnings for the first quarter, S&P 500 earnings should wind up increasing 52.5% year-over-year on 13.5% revenue growth. This is a large increase versus the expectation that first quarter earnings would increase 25.0% when the earnings reporting season started. Looking ahead, second quarter earnings are currently expected to increase 63.0% year-over-year on 18% revenue growth. This should mark the peak of the relative comparison against the trough of COVID from 2020. Third quarter earnings are expected to increase 24.0% and fourth quarter earnings are expected to increase 16.7%. Full-year 2021 earnings are expected to increase 36.0%. This week seven companies in the S&P 500 Index are scheduled to report earnings.
Initial unemployment claims for the week of May 22nd decreased to 406,000 versus the previous week at 440,000. Continuing claims for May 15th were 3.642 million versus 3.738 million the week prior. We will get additional data this coming Friday with the May jobs report.
In our Dissecting Headlines section, we will look at some additional data contributing to the inflation debate.
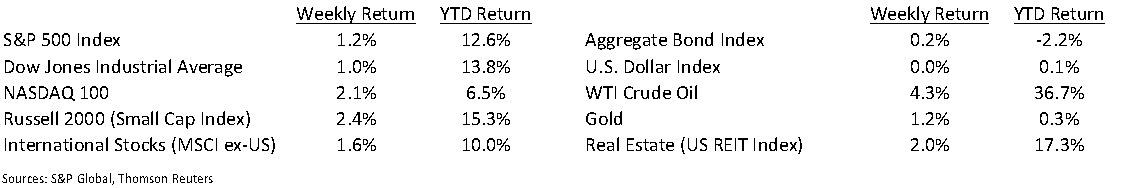
Financial Market Update
Dissecting Headlines: Personal Consumption Expenditures
The Personal Consumption Expenditures (PCE) Index is another measure of price changes for consumers. Like the Consumer Price Index, it measures prices of goods and services commonly purchased by households. There are some differences in the methodology between the two such as the PCE being able to reflect consumer substitution of items as prices change and the CPI measuring urban households versus the PCE measuring all households as well as nonprofit institutions serving households. The data for both indices come from separate surveys as well. The Federal Reserve focuses on the PCE as its primary gauge for consumer inflation mainly because of the wider scope and the substitution effect measurements.
For April, the PCE showed prices up +0.6% month-to-month and +3.6% year-over-year. This compares to the April CPI which was +0.8% month-to-month and +4.2% year-over-year. Since the CPI data is released earlier in the month, it generally captures the headlines. Last week’s PCE release was not as much of a news shock and both the fixed income and equity markets appeared to absorb the information well, however, the persistent versus transitory inflation debate is likely to remain.
________________________________________
Want a printable version of this report? Click here: NovaPoint June 1, 2021
To learn more about these topics and our investment strategies, call us at 404-445-7885 or contact us here.
Do you understand your personal investment risk tolerance and the risk of your current portfolio? You can learn these by taking our Risk Analysis Questionnaire.