
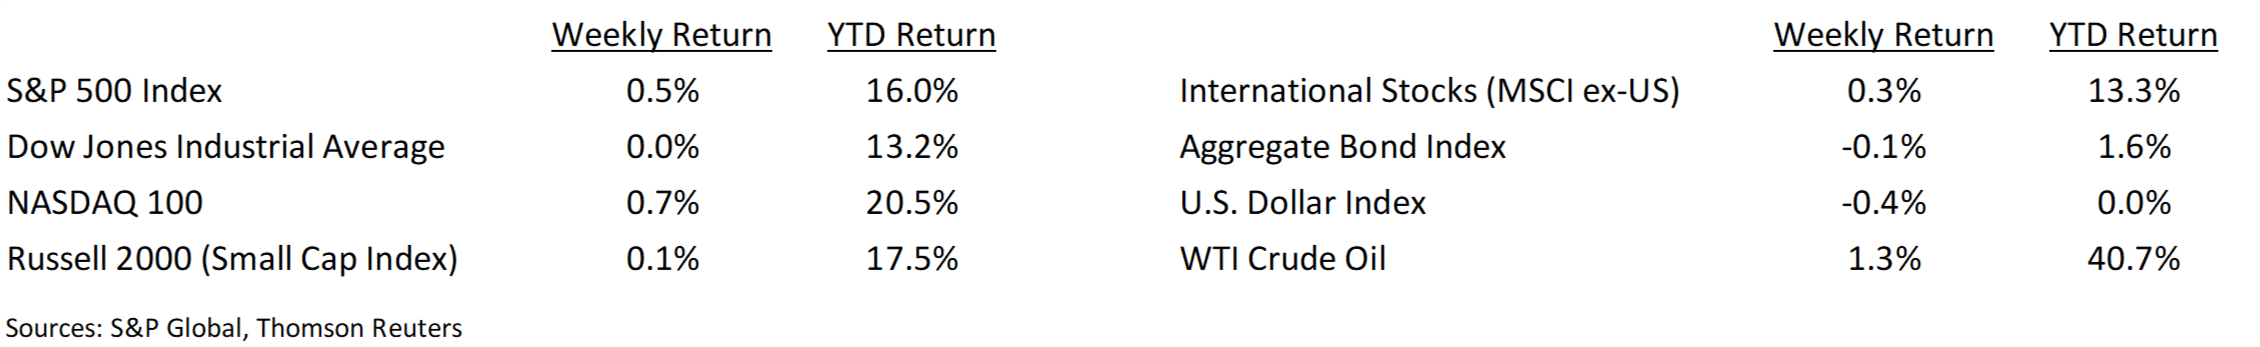
The S&P 500 Index had a muted week but then generated some excitement on Friday with earnings from banks such as JP Morgan and Wells Fargo, an energy sector merger announcement with Chevron and Anadarko Petroleum, and Disney’s announcement of its direct-to-consumer media service. The S&P 500 Index closed the week +0.5% higher.
The building calendar of company earnings releases continues in the coming week with more reports in the financial and other sectors. Twenty-nine of the 500 companies have reported earnings quarter-to-date.
The minutes of the March Fed meeting leased this week showed that Fed has no immediate plans to return to a Hawkish posture. This sets a constructive backdrop to help balance risks such as slowing economic growth. The market has rebounded strongly from the fourth quarter 2018 decline. Friday’s S&P 500 closing level of 2,907.4 is +16.0% YTD and not far below its closing high of 2,940.9 in September of 2018.
Factors impacting market direction over the next few weeks should be the impact of post-earnings stock moves in larger companies in the indices, the progress of U.S.—China trade negotiations, and data points reflecting the health of the economy.
Financial Market Update
Dissecting Headlines: Price-to-Earnings Ratio
We discussed Earnings Per Share in last week’s commentary. This week we use the EPS data point as a quick valuation check with the Price-to-Earnings ratio, or PE ratio. The PE ratio is calculated by dividing a stock’s price by its earnings per share. For example, a $25 per share stock price with earnings per share of $2.50 for the year would have a 10x PE Ratio.
PE ratios can either be trailing for forward looking. Trailing PE is based on the previous four quarters of earnings and forward PE is based on the upcoming four quarters of expected earnings. Using the original example, the $25 stock that earned $2.50 per share over the past four quarters has a 10x trailing PE ratio. If that company is expected to grow its earnings 10% to $2.75 over the next four quarters its forward PE ratio is 9.1x.
PE ratios can be used to compare the valuation of a stock to its own history (cheaper or more expensive than its historical average), its peer companies (PE of Coca-Cola v. Pepsi, or Verizon v. AT&T), or to the market (the forward PE of the S&P 500 is currently 17.0x for 2019). PE ratios have nuance when used for valuation decisions and we will cover “relative valuation” in next week’s commentary.
___________________________________________________________
Want a printable version of this report? Click here: NovaPoint April 15, 2019
To learn more about these topics and our investment strategies, call us at 404-445-7885 or contact us here.
Do you understand your personal investment risk tolerance and the risk of your current portfolio? You can learn these by taking our Risk Analysis Questionnaire.