
The S&P 500 Index posted its third consecutive weekly decline. The decline wound up being smaller than the start of the week would have indicated, as the market rallied strongly on Thursday and Friday.
The week started down when the September ISM Manufacturing Report showed contraction in the manufacturing sector. The Index level of 47.8 was lower from August’s 49.1 and below the consensus expectation of 50.2. A reading below 50 indicates contraction. This was followed by the ISM Non-Manufacturing Report at a level of 52.6, indicating expansion, but below August’s 56.4 and below consensus expectations of 55.4. The Non-Manufacturing Report represents a larger part of the economy (see Dissecting Headlines below), so the economy is still growing, albeit at a potentially slower pace.
The stock market rallied Thursday on the thought that the weaker ISM Reports would be enough of a catalyst to get another short-term interest rate reduction from the Federal Reserve at its October 29th-30th meeting. There was a follow-through on Friday after the September employment report showed only a modestly lower number of jobs created versus expectations.
Third quarter earnings are underway with 21 companies in the S&P 500 reporting to date. Current consensus expectation is for a year-over-year decline in earnings for the S&P 500 Index. Consensus earnings are expected to decline 2.7% year-over-year on a 3.6% increase in revenue.
The coming week is light on economic data with the Producer Price Index and Consumer Price Index the only major releases. Third quarter earnings season doesn’t ramp up until the following week, so any significant market movement may be due to global trade or other geopolitical factors.
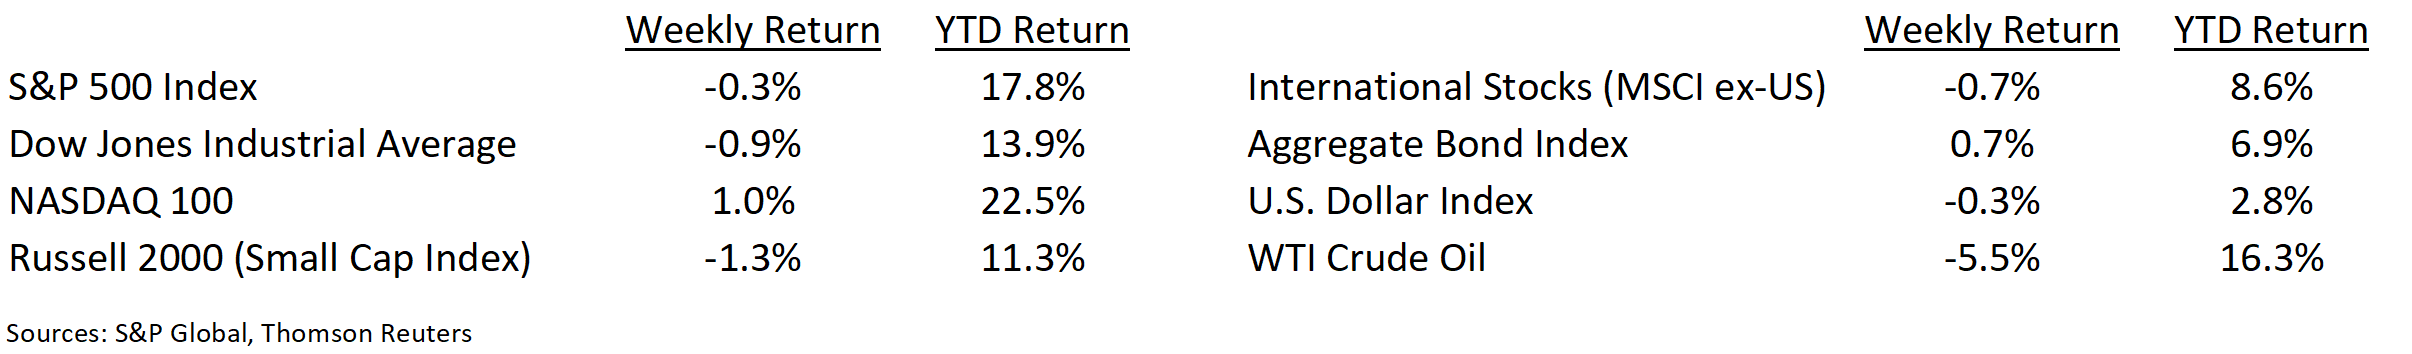
Financial Market Update
Dissecting Headlines: Manufacturing versus Services
The September ISM Manufacturing Report showed a contraction of activity and the Non-Manufacturing Report showed expansion. While both are important elements of the economy, manufacturing (including exports) is approximately one-third of the economy, while services (“non-manufacturing” in the ISM Report) is approximately two-thirds.
The offshoring of manufacturing over the past few decades, growth in financial and healthcare services, and an overall shift to an intellectual capital economy has made services an increasing part of the economy. A modest contraction in manufacturing can be compensated by an expansion in services.
The overall economic growth is measured by GDP (“Gross Domestic Product”) which, based on 2018 GDP, is 69% personal consumption, 18% business investment, 17% government spending, and negative 4% net exports. Within personal consumption, about two-thirds is services and one-third is products.
___________________________________________________________
Want a printable version of this report? Click here: NovaPoint October 7, 2019
To learn more about these topics and our investment strategies, call us at 404-445-7885 or contact us here.
Do you understand your personal investment risk tolerance and the risk of your current portfolio? You can learn these by taking our Risk Analysis Questionnaire.