
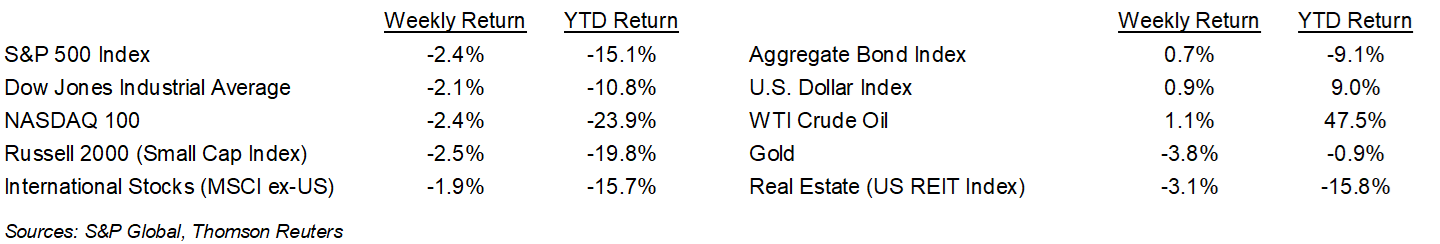
Despite Friday’s strong relief rally, stocks still ended last week lower. The S&P 500 ended the week -2.4%, the Dow was -2.1%, and the NASDAQ was -2.4%. The 10-year U.S. Treasury note yield decreased to 2.928% at Friday’s close versus 3.142% the previous week.
Both the Consumer Price Index (CPI) and Producer Price Index (PPI) for April remained elevated. The CPI was +8.3% year-over-year and +6.2% excluding food and energy. The month-to-month change was +0.3%, a slower rate than +1.2% in March, so there is a sense that accelerated inflation may be peaking. The PPI was +6.5% year-over-year and +4.8% excluding food and energy. The month-to-month change was +1.0%, the same as March.
Containing inflation is the Federal Reserve’s number one priority currently. We think eventual signs of inflation abating are the catalyst for an equity market recovery. The Fed has outlined a path that likely includes 0.50% increases in the Fed funds rate at each of the next three Federal Open Market Committee meetings to be held in June, July, and September. At that point, they will have brought monetary policy to a neutral level and can potentially wait until after the midterm elections for further action.
The first quarter earnings period sees reports from several of the larger retail companies this week. Overall, 16 companies in the S&P 500 Index are scheduled to report earnings this week. The current consensus for 1Q22 is 11.1% earnings growth on 13.8% revenue growth versus 6.1% earnings growth on 10.9% revenue growth at the start of the earnings season. For the 458 companies in the S&P 500 that have already reported first quarter earnings, 77.9% have reported earnings above analyst estimates. This compares to a long-term average of 66% and prior four quarter average of 83.1%.
In our Dissecting Headlines section, we look at the ripple effect of higher energy prices.
Financial Market Update
Dissecting Headlines: Energy Markets
The largest year-over-year increase in the CPI and PPI has been energy prices. As of Friday, oil prices were 73% higher year-over-year and natural gas prices were 157% higher year-over-year. Consumers see the impact of higher energy prices most easily in the price of gasoline when they fill up at the pump, or when they get the home energy bill from their utility provider.
Higher crude oil and natural gas prices flow through to many areas of the economy. In the United States, 44% of crude oil consumption goes to motor vehicle gasoline, 21% goes to distillate fuels such as diesel, 18% goes to hydrocarbon gas liquids such as butane, 6% goes to jet fuel and aviation gasoline, and the remaining 11% goes to a variety of uses such as asphalt, lubricants, and petrochemical feedstocks. With natural gas, 38% goes to electric power generation, 33% goes to industrial production for heat and power, as well as feedstocks for chemicals, fertilizer and other products, 15% goes to homes for cooking and heating, 10% goes to the commercial sector for cooking, refrigeration, and other uses, and the remainder goes to the transportation sector for buses and other vehicles that use compressed natural gas.
This means the follow-on impact of higher energy prices is higher cost to produce and transport goods, staff offices, schools, and other institutions, and prepare and transport food for both on-premise and at-home consumption. A supply response to meet current demand would be helpful toward moderating prices without constraining growth.
________________________________________
Want a printable version of this report? Click here: NovaPoint May 16, 2022
To learn more about these topics and our investment strategies, call us at 404-445-7885 or contact us here.
Do you understand your personal investment risk tolerance and the risk of your current portfolio? You can learn these by taking our Risk Analysis Questionnaire.