
This week we will start to see the companies reporting second quarter earnings show us their cards. Due to uncertain outlooks at the height of the COVID back in April, more than 180 companies in the S&P 500 Index declined to provide earnings guidance, so we may have a wider range of outcomes than are normally seen. The thirty-two companies reporting earnings this week may likely set the stage for the market over the next few weeks. Overall, S&P 500 earnings for the second quarter are forecast to decline 44.0% on a 11.5% revenue decline. This is coincident with U.S. second quarter GDP currently forecast to be down 34.8%.
Monitoring weekly and monthly economic data, there are multiple data points indicating that economic conditions have improved over the past few months. We will be looking for corroborating evidence in the earnings reports that the second quarter is the trough in the economy and that companies have adapted to business moving forward. Barring another COVID-like event, we should see incremental growth in the second half of 2020 and above-average growth in 2021.
One of the weekly economic data points we have been reporting on is the change in employment as measured by initial unemployment claims. For the week of July 4th, initial claims decreased to 1.314 million versus 1.413 million the week prior. The four-week moving average decreased to 1.437 million. Continuing claims for June 27th were 18.062 versus 18.760 the week prior. The peak in weekly initial claims was 6.867 million for the week of March 28th and the peak in continuing claims was 22.790 million the week of May 9th. Several more months of sequential improvement in employment are necessary to return the U.S. economy to pre-COVID levels.
In our Dissecting Headlines section, we explain what consensus earnings estimates are and how they are used as a benchmark for quarterly earnings reports.
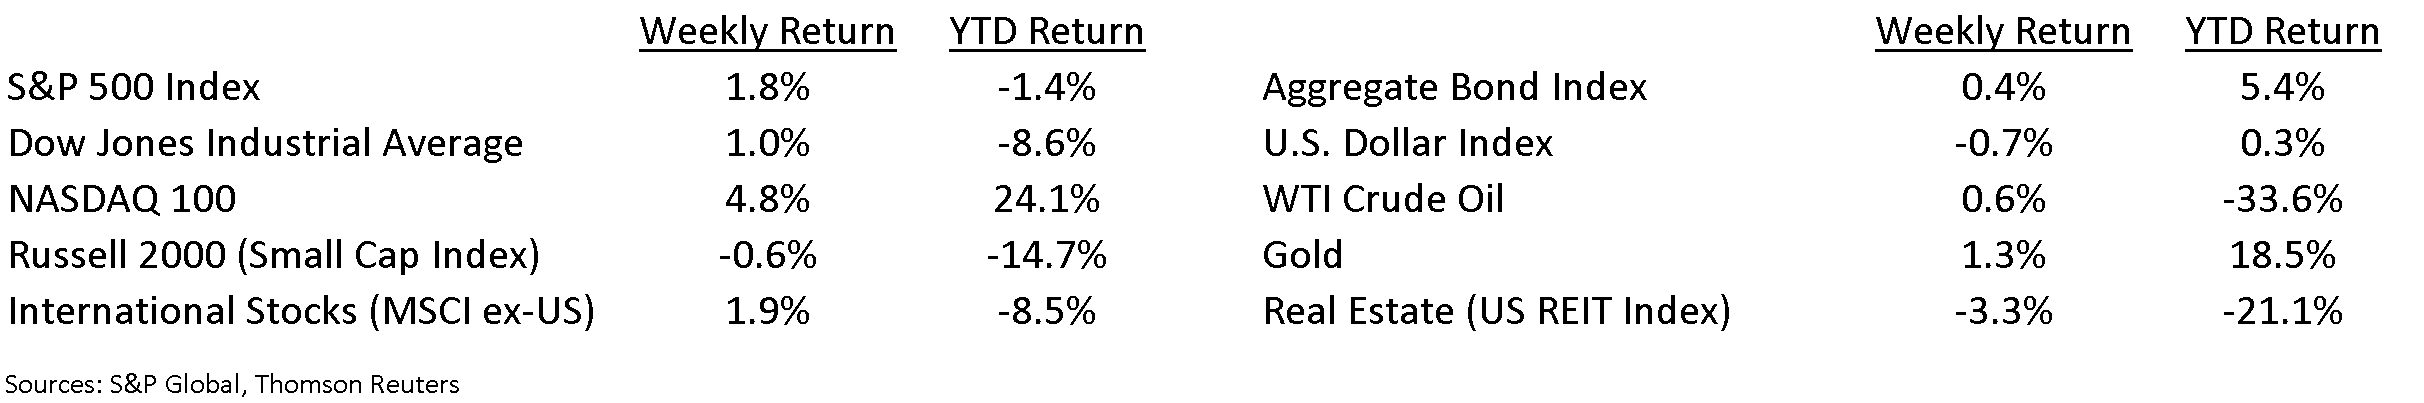
Financial Market Update
Dissecting Headlines: Consensus Earnings Estimates
Part of investors’ view if a company has had a good or bad quarterly earnings report is how the earnings compare to consensus estimates. Most major banks and brokerage firms have research analysts that publish their estimates for companies in different industries. These estimates are collected by market data providers and consensus estimates are published. These are the benchmarks that news services use in their headlines to compare a company’s reported earnings to what was expected.
For large companies there are 25 or more analysts contributing to the consensus estimate, so the consensus number is a reasonable view of what a large group of analysts think. For smaller companies, there may be only one or two analysts, so the consensus may be an average of two disparate views.
The consensus estimates for all the stocks in the S&P 500 Index are rolled up into expectations for the Index that we mentioned at the top of this report with second quarter S&P 500 earnings forecast to decline 44.0% on an 11.5% revenue decline.
As you watch companies report their earnings over the coming weeks, the stock price reaction is likely going to be based on current quarter performance versus consensus expectations and the company’s forward outlook against the consensus.
___________________________________________________________
Want a printable version of this report? Click here: NovaPoint July 13, 2020
To learn more about these topics and our investment strategies, call us at 404-445-7885 or contact us here.
Do you understand your personal investment risk tolerance and the risk of your current portfolio? You can learn these by taking our Risk Analysis Questionnaire.