
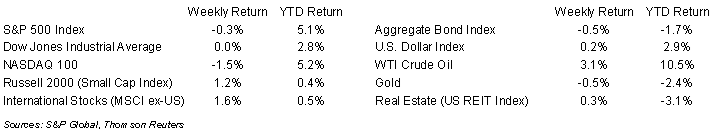
The S&P 500 Index had only its second weekly loss year-to-date but did stay above the 5,000 level. For the week, the S&P 500 Index was -0.3%, the Dow was just a touch positive, and the NASDAQ was -1.5%. The S&P 500 Index was led by the Energy, Materials, and Utility sectors, while the Technology, Consumer Discretionary, and Communication Services sectors lagged. The 10-year U.S. Treasury note yield increased to 4.295% at Friday’s close versus 4.187% the previous week.
The Consumer Price Index (CPI) and Producer Price Index (PPI) reports for January showed inflation remained sticky. CPI was +0.3% month-over-month (m/m) and +3.1% year-over-year (y/y). Core CPI, which excludes food and energy prices, was +0.4% m/m and +3.9% y/y. PPI was +0.3% m/m and +0.9% y/y. Core PPI was +0.6% m/m and +2.6% y/y. The reports have caused a shift in investor expectations that the Federal Reserve may not lower short-term interest rates until June. CME Fed funds futures imply a 90% probability that rates remain in the 5.25% to 5.50% target range for March and 61.6% for May. The probability for a first rate cut in June is 53.7%.
We are in the tail-end of the fourth quarter earnings reporting period with 395 companies in the S&P 500 Index already reported. An additional 33 companies are scheduled to report earnings this week. Current fourth quarter expectations for the S&P 500 Index are earnings growth of 9.6% and revenue growth of 3.3%. For full-year 2023, S&P 500 Index earnings are expected to grow by 4.0% with revenue growth of 2.1%. For full-year 2024, earnings are expected to grow by 9.5% with revenue growth of 4.8%.
In our Dissecting Headlines section, we breakdown the CPI to see where inflation is impacting the economy.
Financial Market Update
Dissecting Headlines: Inside the CPI
January CPI showed consumer prices 3.1% higher y/y. While most price categories remain higher, they are partially offset by some deflationary categories.
If a recent trip to the supermarket felt expensive and eating out felt even more expensive, you would be correct. Food away from home (i.e., restaurants) is 5.1% higher y/y whereas food at home (i.e., grocery purchases) is only 1.2% higher y/y with some categories such as meat (-0.9% y/y) and dairy (-1.1% y/y) helping stem overall price increases.
Pump prices at the gas station might look lower with gasoline prices 6.4% lower y/y. At home, your utility bill may be a mix with electricity prices 3.8% higher y/y, but natural gas services 17.8% lower y/y.
In the core inflation areas, shelter prices remain inflationary, +6.0% y/y. This is an important category since it counts for more than one-third of the overall CPI. Other inflationary categories in the core include hospital services +6.7%, motor vehicle maintenance and repair +6.5%, and motor vehicle insurance +20.6% y/y. These are partially offset by used vehicle prices -3.5% and airline fares -6.4%.
Taking a trip, by car or plane, looks attractive, but it will cost more to eat when you get there.
________________________________________
Want a printable version of this report? Click here: NovaPoint Weekly February 20, 2024
To learn more about these topics and our investment strategies, call us at 404-445-7885 or contact us here.
Do you understand your personal investment risk tolerance and the risk of your current portfolio? You can learn these by taking our Risk Analysis Questionnaire.