
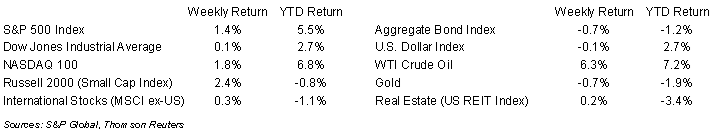
Investors have shown stocks a lot of love so far this year, pushing the S&P 500 Index above the 5,000 level for the first time. For the week, the S&P 500 Index was +1.4%, the Dow was +0.1%, and the NASDAQ +1.8%. The S&P 500 Index was led by the Technology, Consumer Discretionary, and Health Care sectors, while the Utility, Consumer Staples, and Communication Services sectors lagged. The 10-year U.S. Treasury note yield increased to 4.187% at Friday’s close versus 4.031% the previous week.
The next reports on inflation are scheduled for this week with the January Consumer Price Index (CPI) scheduled for release on Tuesday and the January Producer Price Index (PPI) scheduled for Friday. CME Fed funds futures currently indicate an 84.5% probability that the Federal Open Market Committee (FOMC) keeps interest rates the same at the March FOMC meeting and a 54.5% probability the first reduction in interest rates comes at the May meeting.
Fourth quarter earnings reports continue this week with 45 companies in the S&P 500 Index scheduled to report earnings. Current fourth quarter expectations for the S&P 500 Index are earnings growth of 9.0% and revenue growth of 3.4%. For full-year 2023, S&P 500 Index earnings are expected to grow by 3.9% with revenue growth of 2.1%. For full-year 2024, earnings are expected to grow by 9.7% with revenue growth of 4.8%.
In our Dissecting Headlines section, we look at the progress of the S&P 500 Index through its milestone levels.
Financial Market Update
Dissecting Headlines: S&P 500 Index by the Thousands
If you look at a chart showing the price level of the S&P 500 Index over its history, two things stick out: first, it moves up over time, and second, it is volatile.
The price history of the S&P 500 Index goes back to 1926 when it was an index of 90 stocks. The 500 stock index came into being in 1957 and closed at a price level above 50 (yes, just a two digit number) in September 1958. It would then see the 500 level by March 1995.
The S&P 500 Index first achieved the 1,000 level in February 1998. It went on to 1,552 by March 2000 during the height of the dot-com bubble. Once the dot-com bubble burst, the Index didn’t see that level again until July 2007. After achieving 1,565 in October 2007, it fell back below 1,000 again during the global financial crisis, getting as low as 666 in March 2009.
The Index hit the 2,000 level in August 2014 and the 3,000 level in July 2019. It rose further to 3,386 in February 2020, then fell back during the early days of the COVID-19 pandemic in March 2000 as low as 2,237. It regained the 3,000 level quickly by May 2020, then went onto the 4,000 level in April 2021. It fell as low as 3,577 during the recent October 2022 lows, and now has gone on to the 5,000 level this past Friday.
The take away is that investing provides growth in value over time, but economic and geopolitical uncertainty can cause severe volatility at different points in history. Time in the market can be better than timing the market.
________________________________________
Want a printable version of this report? Click here: NovaPoint Weekly February 12, 2024
To learn more about these topics and our investment strategies, call us at 404-445-7885 or contact us here.
Do you understand your personal investment risk tolerance and the risk of your current portfolio? You can learn these by taking our Risk Analysis Questionnaire.