
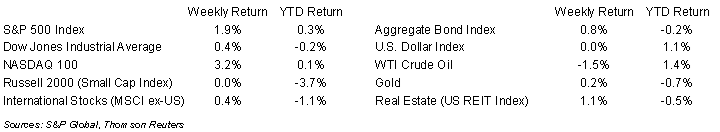
The major equity indices rebounded from the initial down week of 2024. For the week, the S&P 500 Index was +1.9%, the Dow was +0.4%, and the NASDAQ +3.2%. The S&P 500 Index was led by the Technology, Communication Services, and Consumer Staples sectors, while the Energy, Utility, and Materials sectors lagged. The 10-year U.S. Treasury note yield decreased to 3.950% at Friday’s close versus 4.042% the previous week.
Economic data has been mixed with the Consumer Price Index (CPI) showing a stronger inflation and the Producer Price Index (PPI) showing weaker inflation. There may be some near-term volatility until data starts to align in a clear direction consistent with the Federal Reserve’s projections to provide confidence in monetary policy direction. The probabilities of an initial 0.25% rate cut in March are currently to 69.0% from 60.8% last week, based on CME Fed funds futures.
Twenty companies in the S&P 500 Index are scheduled to report earnings this week. Current fourth quarter expectations for the S&P 500 Index are earnings growth of 4.4% and revenue growth of 2.6%. For full-year 2023, S&P 500 Index earnings are expected to grow by 2.9% with revenue growth of 1.9%. For full-year 2024, earnings are expected to grow by 11.0% with revenue growth of 5.1%.
In our Dissecting Headlines section, we look at inflation, deflation, and disinflation.
Financial Market Update
Dissecting Headlines: Inflation, Deflation, and Disinflation
The December CPI report showed consumer prices 3.4% higher year-over-year. Core prices, which exclude food and energy, were 3.9% higher year-over-year. The PPI report showed wholesale prices 1.0% higher year-over-year and core prices 2.5% higher. The Indices measure different sets of goods and services and both show that overall prices are still higher on an annual basis. This is what we generally recognize as inflation with prices higher year-over-year. A moderate level of inflation is seen by most economists as a sign of healthy growth and the Federal Reserve views 2% annual inflation as normal.
The Fed has been striving for the past two years to slow the rate of inflation, or create a path of disinflation. A disinflationary economy can still experience growth, but in an environment of better price stability. This is the path we are currently experiencing with Gross Domestic Product seeing moderate but positive growth and aggregate prices returning to a more moderate level of annual inflation. If we look back at December 2022, the CPI was 6.5% higher year-over-year and December 2021 CPI was 7.0%. This makes the 3.4% growth in prices disinflationary relative to the previous periods.
The 3.4% rise in consumer prices in 2023 compounds on the previous periods of rising prices, so while being disinflationary, prices have not gone down. A decline in prices is defined as deflation. Moderating economic growth, in aggregate, typically exhibits disinflation rather than deflation. Within specific categories, however, deflation exists. In 2023, used vehicle prices declined 1.3% and medical care declined 0.5%, helping contribute to overall disinflation while categories such as shelter prices rose 6.2%. Energy prices also declined 2.0% in 2023, and it is usually commodity prices such as energy and food that can exhibit more volatile inflation and deflation cycles. This is why food and energy are excluded when measuring core prices. We also see deflation in products or services experiencing substitution or obsolescence. Prices can also fall for a product as it reaches greater consumer penetration and mass production has allowed it to be produced cheaper.
Look for a continued path of disinflation toward a 2% annual rate as the end goal for the current Fed monetary policy cycle.
________________________________________
Want a printable version of this report? Click here: NovaPoint Weekly January 16, 2024
To learn more about these topics and our investment strategies, call us at 404-445-7885 or contact us here.
Do you understand your personal investment risk tolerance and the risk of your current portfolio? You can learn these by taking our Risk Analysis Questionnaire.