
Stocks remain at record levels on optimism for a partial trade truce. As we head into the final leg of corporate earnings season, we anticipate that macroeconomic and geopolitical headlines should continue to dominate market direction day-to-day.
Earnings have shown a more positive picture than was expected in late September. Of the 461 companies that have reported 3Q earnings, 75% have exceeded expectations, 7% have met expectations and 18% have reported below expectations. Current expectation is for a 0.4% decline in year/year earnings on 3.8% revenue growth versus last week’s consensus of a 0.5% earnings decline on a 3.9% increase in revenue. Excluding the Energy sector, earnings are expected to grow 2.2% y/y. For the coming week, 16 companies in the S&P 500 are scheduled to report earnings. Many of the companies still to report earnings are retailers which have their fiscal quarter close a month later (October versus September) than the majority of companies in the S&P 500 Index.
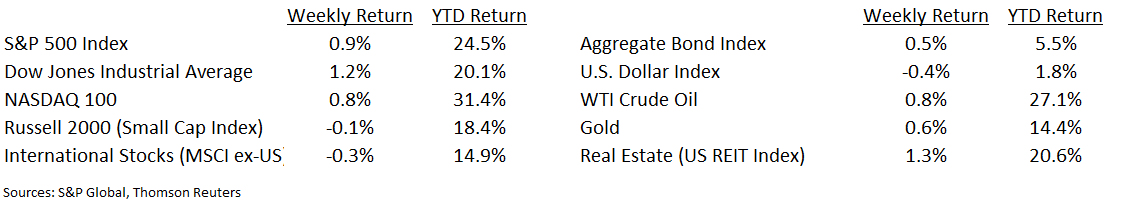
The Dow Jones Industrial Average hit 28,000 this past week and the S&P 500 Index hit 3,120. In our Dissecting Headlines section, we’ll explain how financial news headlines can sometimes favor quoting the Dow because the larger numerical value of the Index can lend itself to more exciting headlines.
Financial Market Update
Dissecting Headlines: Soaring and Plunging
The Dow Jones Industrial Average (“Dow”) is comprised of 30 of the largest stocks in the United States. While the stocks are representative of several economic sectors, the Dow is often considered too narrow to be the best representation of the U.S. stock market. One place the Dow does get often mentioned is in the financial media.
The numerical level of the Dow topped 28,000 this past week. The index is not market capitalization weighted and is instead based on factor of the stock prices within it. The S&P 500 Index is likely a more representative sample of the U.S. stock market and has a current numerical level of around 3,120. A change in value (or “points”) leads to the Dow being often quoted as a representation of how the stock market is faring any day. A 1% move in the Dow is equal to around 280 points, whereas a 1% move in the S&P 500 is equal to around 31 points. This makes movements in the Dow more exciting for news headlines, especially when attached to compelling adjectives such as “Dow soars 100 points” or “Dow plunges 100 points”. One hundred points on the Dow is equal to less than one half of one percent. It just sounds more exciting to write “Dow soars 100 points” than “S&P 500 soars 11 points”.
While we are often drawn to adjectives in news headlines, the truth is more often in the numbers. In the case of the stock market indices, the percentage movement is often a better indication than the numerical price movement.
___________________________________________________________
Want a printable version of this report? Click here: NovaPoint November 18, 2019
To learn more about these topics and our investment strategies, call us at 404-445-7885 or contact us here.
Do you understand your personal investment risk tolerance and the risk of your current portfolio? You can learn these by taking our Risk Analysis Questionnaire.