
Downward market pressure early in the week reversed once the Russian invasion of Ukraine began. Markets began climbing the Wall of Worry we mentioned last week. The situation in Ukraine may continue to dominate headlines this week, but the U.S. economy comes back centerstage with the February Employment Report on Friday. President Biden is also scheduled to make his State of the Union address on Tuesday evening.
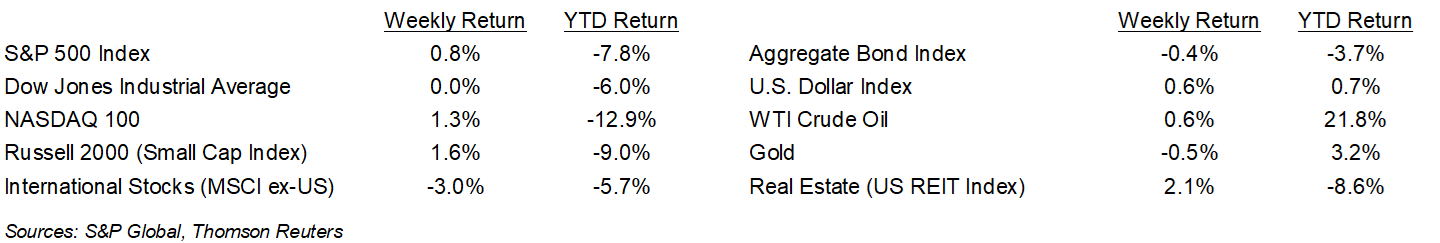
The S&P 500 Index ended the week +0.8%, the Dow was flat, and the NASDAQ was +1.3%. The U.S. 10-year Treasury bond yield increased to 1.970% at Friday’s close versus 1.927% the previous week.
For the fourth quarter of 2021, 472 companies in the S&P 500 Index have reported earnings results and 76.9% have reported earnings above analyst estimates. This compares to a long-term average of 65.9% and prior four quarter average of 83.9%. The current consensus forecast is for fourth quarter earnings to grow 31.5% on 14.9% revenue growth versus an expectation of 22.4% earnings growth on 12.1% revenue growth at the start of the earnings season. During the coming week, 23 companies in the S&P 500 Index are scheduled to report earnings.
In our Dissecting Headlines section, we look at the contrast between the Personal Consumption Expenditures Index and Consumer Price Index in measuring inflation.
Financial Market Update
Dissecting Headlines: PCE and CPI
The January Personal Consumptions Expenditures (PCE) Index showed year/year inflation at +6.1% and +5.2%, excluding food and energy. This compares to the Consumer Price Index (CPI) which showed +7.5% increase in prices year/year and +6.0% ex food and energy year/year for January.
The CPI appears to be the more popular of the two price measurements in the financial media. It gets released earlier in the month and it is used to adjust social security payments, while also being the reference rate for some financial contracts such as Treasury Inflation Protected Securities (TIPS). The Federal Reserve prefers to look at the PCE when it is considering the level of price inflation in the economy.
Both Indices measure the change in price of a basket of goods and services, but the weightings in each basket can differ. The CPI is based on a survey of what households are buying, while the PCE is based on surveys of what businesses are selling. Another difference is that CPI measures what consumers pay out of pocket and doesn’t include some expenditures such as medical care paid for by employer-provided insurance, Medicare, and Medicaid, all of which are included in the PCE. The last major difference, which we think is the easiest to understand, is the substitution effect. If the price of beef increases more than the price of chicken, consumers may buy less beef and more chicken. This realignment of the basket is accounted for in the PCE, but not the CPI.
While both measures are useful in understanding the level of inflation in the economy, in a period where the Fed is going to begin raising rates to combat inflation, monitoring the PCE Index has value.
________________________________________
Want a printable version of this report? Click here: NovaPoint February 28, 2022
To learn more about these topics and our investment strategies, call us at 404-445-7885 or contact us here.
Do you understand your personal investment risk tolerance and the risk of your current portfolio? You can learn these by taking our Risk Analysis Questionnaire.