
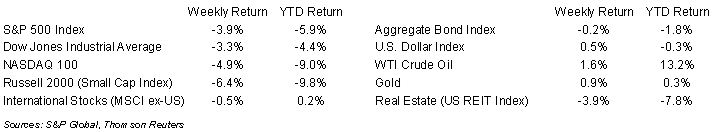
The early year market retreat extended to a third week. The S&P 500 Index ended the week -3.9%, the Dow was -3.3%, and the NASDAQ was -4.9%. The U.S. 10-year Treasury bond yield decreased to 1.771% at Friday’s close versus 1.793% the previous week.
Some of the downturn can be attributed to the high inflation trends that have prompted the Federal Reserve to plan monetary tightening for 2022. The first of this year’s Federal Reserve Federal Open Market Committee meetings is scheduled for this week. We should get a current update from Fed Chairman Jerome Powell at the press conference following the Fed’s post-meeting announcement on Wednesday afternoon.
For the fourth quarter of 2021, 64 companies have reported earnings results and of those 76.6% have reported earnings above analyst estimates. This compares to a long-term average of 65.9% and prior four quarter average of 83.9%. The current consensus forecast is for fourth quarter earnings to grow 23.7% on 12.4% revenue growth versus an expectation of 22.4% earnings growth on 12.1% revenue growth at the start of the earnings season. During the coming week, 104 more companies in the S&P 500 Index are scheduled to report earnings.
In our Dissecting Headlines section, we look at the Volatility Index.
Financial Market Update
Dissecting Headlines: Volatility Index
The Volatility Index, or VIX, is a measure of investor expectations of market volatility over the next 30-days. The VIX was created by the Chicago Board Options Exchange (CBOE) and is derived from prices of S&P 500 Index options. The VIX is sometimes referred to as the Fear Gauge because when it rises this reflects rising investor fear, or pessimism, on the direction of the market.
The VIX has increased from 17.2 at the end of December to 30.9 currently. This is coincident with the retreat in the major stock market indices we have seen since the start of the year. The 30.9 level is above the VIX’s historical average of just under 20 and is a reading that reflects considerable near-term uncertainty. While elevated, these levels are not unprecedented. The VIX was as high as 31.1 at the start of December and had spiked to 82.7 in mid-March 2020 during the initial impact of COVID on the markets.
The indicator can often be a contrarian signal, meaning that it is advantageous to buy when fear is high and sell when optimism reigns. We saw this as the S&P 500 Index rose over the course of 2020 after bottoming out at the end of March 2020, less than two weeks after the spike in the VIX.
________________________________________
Want a printable version of this report? Click here: NovaPoint January 24, 2022
To learn more about these topics and our investment strategies, call us at 404-445-7885 or contact us here.
Do you understand your personal investment risk tolerance and the risk of your current portfolio? You can learn these by taking our Risk Analysis Questionnaire.